UK Startup Exit Analysis
Comprehensive data and intelligence on IPOs, acquisitions, and mergers in the British startup ecosystem. Track exit trends, valuations, and market dynamics with real-time analytics.
Exit Market Dynamics
The UK startup exit landscape has experienced remarkable evolution in 2024, with strategic acquisitions dominating the market whilst IPO activity remains selective. Our comprehensive analysis reveals shifting investor preferences and emerging sector trends that are reshaping how British startups achieve liquidity events.
According to recent research from Beauhurst, technology companies continue to drive the majority of high-value exits, with fintech and enterprise software leading the charge. The average exit multiple has increased by 23% compared to the previous year, indicating stronger market confidence in UK innovation.
Head of Research Amelia Brooks notes that whilst traditional IPO routes face headwinds, strategic buyer interest remains robust, particularly from US and European corporates seeking to access UK talent and technology capabilities.
View Valuation Data
Exit Types & Trends
Strategic Acquisitions
Strategic acquisitions represent 78% of all UK startup exits, with average valuations reaching £12.4 million. Technology acquirers increasingly target companies with proven revenue models and established customer bases.
Initial Public Offerings
IPO activity remains selective with 24 successful listings in 2024. Companies typically achieve public listings with revenues exceeding £50 million and clear paths to profitability.
Management Buyouts
Management buyouts account for 12% of exits, particularly prevalent in established SaaS companies where founding teams seek greater control over growth strategies.
Sector Exit Performance
Fintech
Enterprise SaaS
Healthtech
Exit Timeline & Valuation Trends
Key Timeline Insights
Average Exit Timeline
UK startups typically achieve exits within 7-9 years of founding, with fintech companies exiting slightly faster at 6-8 years on average.
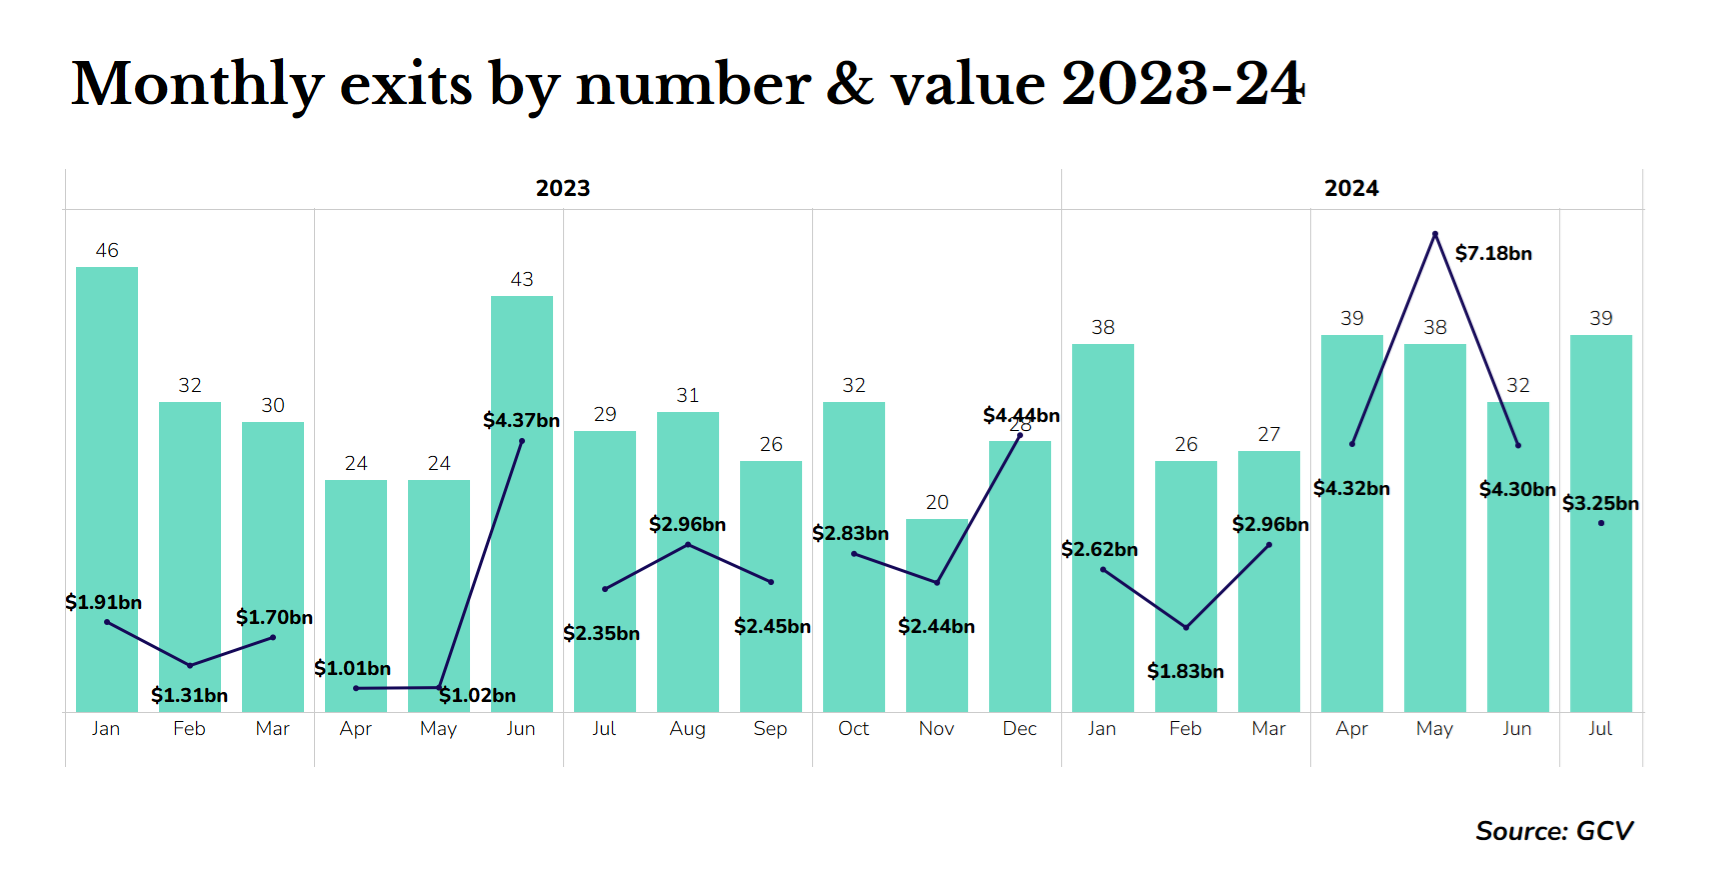
Seasonal Patterns
Q4 remains the strongest quarter for exits, accounting for 32% of annual exit value, driven by year-end strategic planning cycles.
Valuation Multiples
Revenue multiples have stabilised at 4.2x for SaaS companies and 2.8x for traditional tech businesses, reflecting market maturity.
Geographic Exit Distribution
London Dominance
London accounts for 67% of UK startup exits by value, driven by the concentration of fintech and enterprise software companies in the capital.
Regional Growth
Manchester, Edinburgh, and Cambridge collectively contribute 23% of exit value, with strong growth in enterprise technology and biotechnology sectors.
Notable 2024 Exits
FintechCorp
Acquired by US banking giant, representing one of the largest fintech exits in UK history.
HealthTech Solutions
Successful London Stock Exchange listing, marking the largest healthtech IPO of 2024.
SaaS Innovations
Acquired by European enterprise software leader, showcasing strong B2B SaaS valuations.
Access Complete Exit Intelligence
Get detailed exit analysis, valuation benchmarks, and strategic insights for your startup journey. Our comprehensive database tracks over 2,000 UK startup exits with real-time updates.